
A pizza franchise breaks even once monthly revenue covers fixed costs plus variable costs, and for most new units that point arrives somewhere between month eight and month eighteen, depending on sales volume, menu margin, and how tightly you manage food and labour. Industry reporting shows roughly 41% of Canadian foodservice operators were near break-even or operating at a loss in mid-2025, which tells you this is a number worth modelling carefully before you sign anything. We built our own cost structure around a Biga multigrain, artificial additive-free dough specifically because ingredient discipline and menu design are two of the biggest levers a franchise owner actually controls.
TL;DR:
- Small increases in food or labor costs of just 2 to 5 percentage points can significantly delay break-even timelines by thousands of dollars in additional sales.
- Accurate location modeling must consider local demand, foot traffic, delivery density, and seasonality, as these factors heavily influence order volume and revenue.
- Running a pizza franchise typically requires a working capital reserve covering at least six months to handle slow months and startup shortfalls, not just initial build-out costs.
- Delivery-heavy sales channels increase variable costs through commissions, but shifting toward direct app orders can help improve contribution margins and speed up break-even.
- Comparing franchise brands requires reviewing fixed costs, delivery expenses, and average ticket size, as these variables determine each concept’s actual break-even point.
Table of Contents
- Break-even basics and the formula
- Typical cost components for a pizza franchise
- Step-by-step calculation with a numeric example
- Sensitivity analysis: how small changes move break-even
- What franchisor disclosures and conversations should you check
- HellCrust Pizza perspective and practical checklist for franchise candidates
- Timeline and early-months cashflow: what the first year really looks like
- Impact of location and market demographics on break-even point
- Strategies to reduce break-even point through operational efficiencies
- Comparison of break-even points among different pizza franchise brands
- Author perspective: realistic expectations for break-even
- How HellCrust Pizza supports new franchisees
- FAQ
- Sources
Break-even basics and the formula
Break-even is the point where your revenue exactly covers your fixed costs and your variable costs, leaving zero profit and zero loss. Past that point, every additional dollar of sales contributes to profit, assuming your cost ratios hold steady.
Fixed costs stay roughly the same no matter how many pizzas you sell: rent, insurance, equipment leases, and royalty minimums fall here. Variable costs move with sales volume: flour, cheese, sauce, packaging, delivery commissions, and the hourly labour tied to order volume all scale up or down with how busy you are.
The two formulas you need are:
- Break-even sales (in dollars) = fixed costs ÷ contribution margin percentage
- Break-even orders = fixed costs ÷ contribution margin per order
Contribution margin is what is left from an average order after variable costs are subtracted, expressed as a percentage of the ticket. That percentage, multiplied against your monthly fixed costs, tells you exactly how much revenue you need before the business starts generating profit rather than just covering overhead.
Typical cost components for a pizza franchise
Before you can calculate anything, you need a realistic list of what actually hits your profit and loss statement every month, plus what you will spend before you open the doors.
Fixed, recurring costs usually include:
- Rent and occupancy charges, often the single largest fixed line item
- Royalty fees and advertising fund contributions, typically a percentage of gross sales but sometimes with a minimum
- Insurance premiums and equipment lease payments
Variable costs that move with sales include:
- Food and packaging costs, the most volatile line on the sheet
- Delivery platform commissions, which can run meaningfully higher than in-house delivery
- Hourly labour and utilities, both of which scale with order volume and hours of operation
Start-up costs are a separate bucket entirely: the franchise fee itself, build-out and leasehold improvements, point-of-sale systems, initial inventory, and local licences and permits.
Food costs rose significantly and labour costs considerably over the two years before 2025. That kind of sustained cost pressure means the break-even projection in a franchisor's disclosure document, if it is more than a year or two old, may already understate what you will actually face in your first year of operation.
Step-by-step calculation with a numeric example
Here is a worked example using illustrative numbers, not market data, so you can see exactly how the formula moves.
- Gather your inputs: say your monthly fixed costs total $18,000, your average ticket is $28, and your variable cost percentage (food, packaging, and delivery commissions combined) runs 38% of sales.
- Calculate contribution margin percentage: 100% minus 38% equals a 62% contribution margin.
- Calculate break-even sales in dollars: $18,000 ÷ 0.62 equals approximately $29,032 in monthly sales needed just to cover costs.
- Calculate break-even orders: $29,032 ÷ $28 average ticket equals roughly 1,037 orders per month.
- Convert to a daily target: 1,037 orders ÷ 30 days equals about 35 orders per day to hit break-even.
That last number is the one to sanity-check against reality. Thirty-five orders a day sounds modest until you map it against your actual hours of operation, local foot traffic, and delivery radius. A location near a university or dense residential corridor might hit that volume easily during dinner service; a standalone unit in a quieter commercial strip may need every lunch and late-night hour working in its favour.
Seasonality changes the interpretation further. A winter month with more delivery orders and comfort-food demand might outperform a slow summer month when people are travelling or eating on patios elsewhere. Run the calculation for your slowest plausible month, not your average one, because that is the month your cash reserves actually need to survive.
Sensitivity analysis: how small changes move break-even
Small shifts in cost ratios move your break-even point more than most new owners expect, because the formula is unforgiving to margin compression.
- A 2 to 5 percentage point rise in food cost, driven by cheese or flour price swings, can push break-even sales up by several thousand dollars a month depending on your fixed cost base.
- A labour ratio that creeps from 25% to 30% of sales has a similar effect, often adding weeks to your break-even timeline.
- Shifting a larger share of orders onto third-party delivery platforms raises variable costs through commission fees, which pizza market reporting ties directly to margin volatility across the category.
A delivery-heavy sales mix can lower your need for dine-in seating and front-of-house staff, but the commission structure often eats into the savings unless your average ticket or app-based retention offsets it. In-store pickup and app ordering, by contrast, keep more of each dollar on your side of the ledger.
Pro Tip: Track food cost and labour cost as a percentage of sales weekly, not monthly, so you catch a drift before it compounds into a missed break-even month.
Portion control, tighter menu engineering around higher-margin items, and actively managing your delivery platform mix are the three levers that move the needle fastest without requiring new capital.
What franchisor disclosures and conversations should you check
A disclosure document gives you the starting numbers, but it rarely tells the full story of what a specific location will actually earn.
Prioritize these items when reviewing the paperwork:
- Initial franchise fees and all ongoing fees, including royalty percentages and advertising fund minimums
- Any average unit financial performance data the franchisor provides, and how recent it is
- Territory exclusivity terms, since overlapping delivery zones can quietly cannibalize your order volume
Then go talk to existing franchisees directly. Ask how long it actually took them to reach break-even, not what the disclosure projected. Ask what costs surprised them in the first year. Due diligence through franchisee interviews is considered essential precisely because disclosure numbers do not guarantee profitability.
Watch for vague or dated average unit data, franchisees who dodge direct questions about profitability, and projections that assume cost ratios well below the current industry norm. Those are the signs a projection was built for a different cost environment than the one you are stepping into.
HellCrust Pizza perspective and practical checklist for franchise candidates
We built our menu around pizzas, pastas, and sides made with Biga multigrain, artificial additive-free dough, specifically because ingredient quality and menu breadth both support repeat visits, and repeat visits are what move a location past break-even faster than any single promotion.
Our app-based ordering and family-sized deals are designed to lift average ticket and encourage repeat orders, supporting the contribution margin side of your break-even equation. A practical checklist for any candidate evaluating a location: estimate working capital using your slowest projected month, build a staffing plan around realistic order volume rather than hoped-for volume, plan launch promotions that drive trial without destroying margin, and get your app onboarding running before opening day so repeat orders start accumulating immediately. None of this guarantees a specific result, but each piece addresses a real lever in the formula above.
Timeline and early-months cashflow: what the first year really looks like
Most new foodservice units need a working capital cushion covering six to twelve months of operating shortfalls, not just the build-out budget. Industry guidance consistently flags that working capital needs are underestimated, with many new units running at reduced margins or negative cashflow through their startup phase.
The first three months typically carry the steepest gap between revenue and costs, since brand awareness, app adoption, and staff efficiency are all still ramping. Months four through eight usually show steady improvement as repeat customers accumulate and labour scheduling gets tighter against actual demand patterns. By months nine through twelve, a well-run unit with realistic initial assumptions should be approaching or past its break-even threshold.

Build your cash reserve around the slow months, not the average. A reserve sized only to cover an average month leaves no buffer for a slow January or a summer dip, and running out of working capital before reaching break-even is one of the most common reasons a promising location fails before it ever gets the chance to prove itself.
Impact of location and market demographics on break-even point
Location does more to shape your break-even timeline than almost any other single decision you make before opening.
A unit near dense residential housing, a university, or a busy commercial corridor starts with a built-in order volume advantage that a quieter suburban strip mall location simply does not have. Foot traffic and delivery radius density both matter: a tighter delivery radius with more households per square kilometre generally produces faster order fulfillment and lower delivery cost per order than a sprawling, low-density territory.
Local demographics shape your average ticket too. A neighbourhood with more families tends to favour larger family-sized orders and group deals, while a location surrounded by students or young professionals may see more frequent, smaller orders through delivery apps. Both patterns can reach break-even, but the path looks different: family-heavy territories often get there through higher average tickets, while high-frequency territories get there through volume.
Rent also varies enormously by location type, and a lower rent in a less visible location does not automatically mean a faster break-even if it comes with meaningfully lower foot traffic or delivery density. Model both the cost side and the demand side of any location before committing to it.
Strategies to reduce break-even point through operational efficiencies
Lowering your break-even point means either cutting fixed costs, improving your contribution margin, or both at once.
On the fixed-cost side, negotiating favourable lease terms, right-sizing your equipment lease to actual production needs, and avoiding over-staffing relative to realistic order volume all reduce the monthly baseline you need to cover before any profit begins.
On the margin side, portion control and inventory rotation reduce waste, and waste reduction flows straight through to your bottom line since every dollar of spoiled dough or cheese is a dollar that never reached contribution margin. Menu engineering, placing higher-margin items in visually prominent spots on your app and in-store menu, nudges average ticket and overall margin upward without needing a single additional customer.
Managing your delivery platform mix matters just as much. Shifting a larger share of volume toward direct app ordering versus third-party platforms keeps more of each sale on your side of the ledger, since commission-free orders carry a noticeably better contribution margin than commission-heavy ones. Our own app and loyalty-driven ordering model exists in part because direct ordering protects margin in exactly this way.
Finally, review your royalty and advertising fund structure against your actual sales volume regularly. A fee structure that made sense at projected volume may look different once your real order count settles in, and flagging that early gives you more room to adjust other costs in response.

Comparison of break-even points among different pizza franchise brands
Break-even timelines vary meaningfully across the pizza franchise category, largely driven by differences in fixed-cost structure, delivery mix, and menu pricing strategy rather than brand name alone.
A delivery-first specialty concept generally carries a lower fixed-cost break-even threshold than a full-service, dine-in pizzeria, since it needs less square footage, fewer front-of-house staff, and a smaller build-out. Pizza market reporting ties channel mix directly to these margin differences across the category, noting that delivery and takeout trends alongside ingredient-price volatility are central to how profitability plays out brand to brand.
That said, a lower fixed-cost threshold does not automatically mean an easier break-even. Third-party delivery commissions and packaging costs can raise the sales volume needed to reach the same dollar profit, unless the concept offsets that with a higher average ticket or stronger in-app retention that keeps more orders direct. A full-service pizzeria carries heavier fixed costs but often earns a higher average ticket through dine-in add-ons like appetizers, desserts, and beverages, which can narrow the gap.
The honest takeaway for a buyer comparing brands: ask for the actual fixed-cost structure, the delivery commission exposure, and the average ticket for any brand you are evaluating, rather than assuming one category of pizza concept universally breaks even faster than another.
Author perspective: realistic expectations for break-even
Plan for a longer runway than the optimistic version of the math suggests. Every projection assumes steady execution from week one, and real openings rarely work that cleanly.
Talk to several franchisees, not just the ones the franchisor hands you, and build a cash buffer that survives your worst plausible month, not your average one. Then sit down with an accountant and build a break-even model using your own numbers, your own location, and your own assumptions, because a generic model will never fit your specific situation as well as one built around it.
— jaskirat Singh
How HellCrust Pizza supports new franchisees
We built our franchise model around priorities that drive break-even: a tightly controlled menu, an app that encourages repeat orders, and deals structured to raise average ticket without sacrificing ingredient quality.
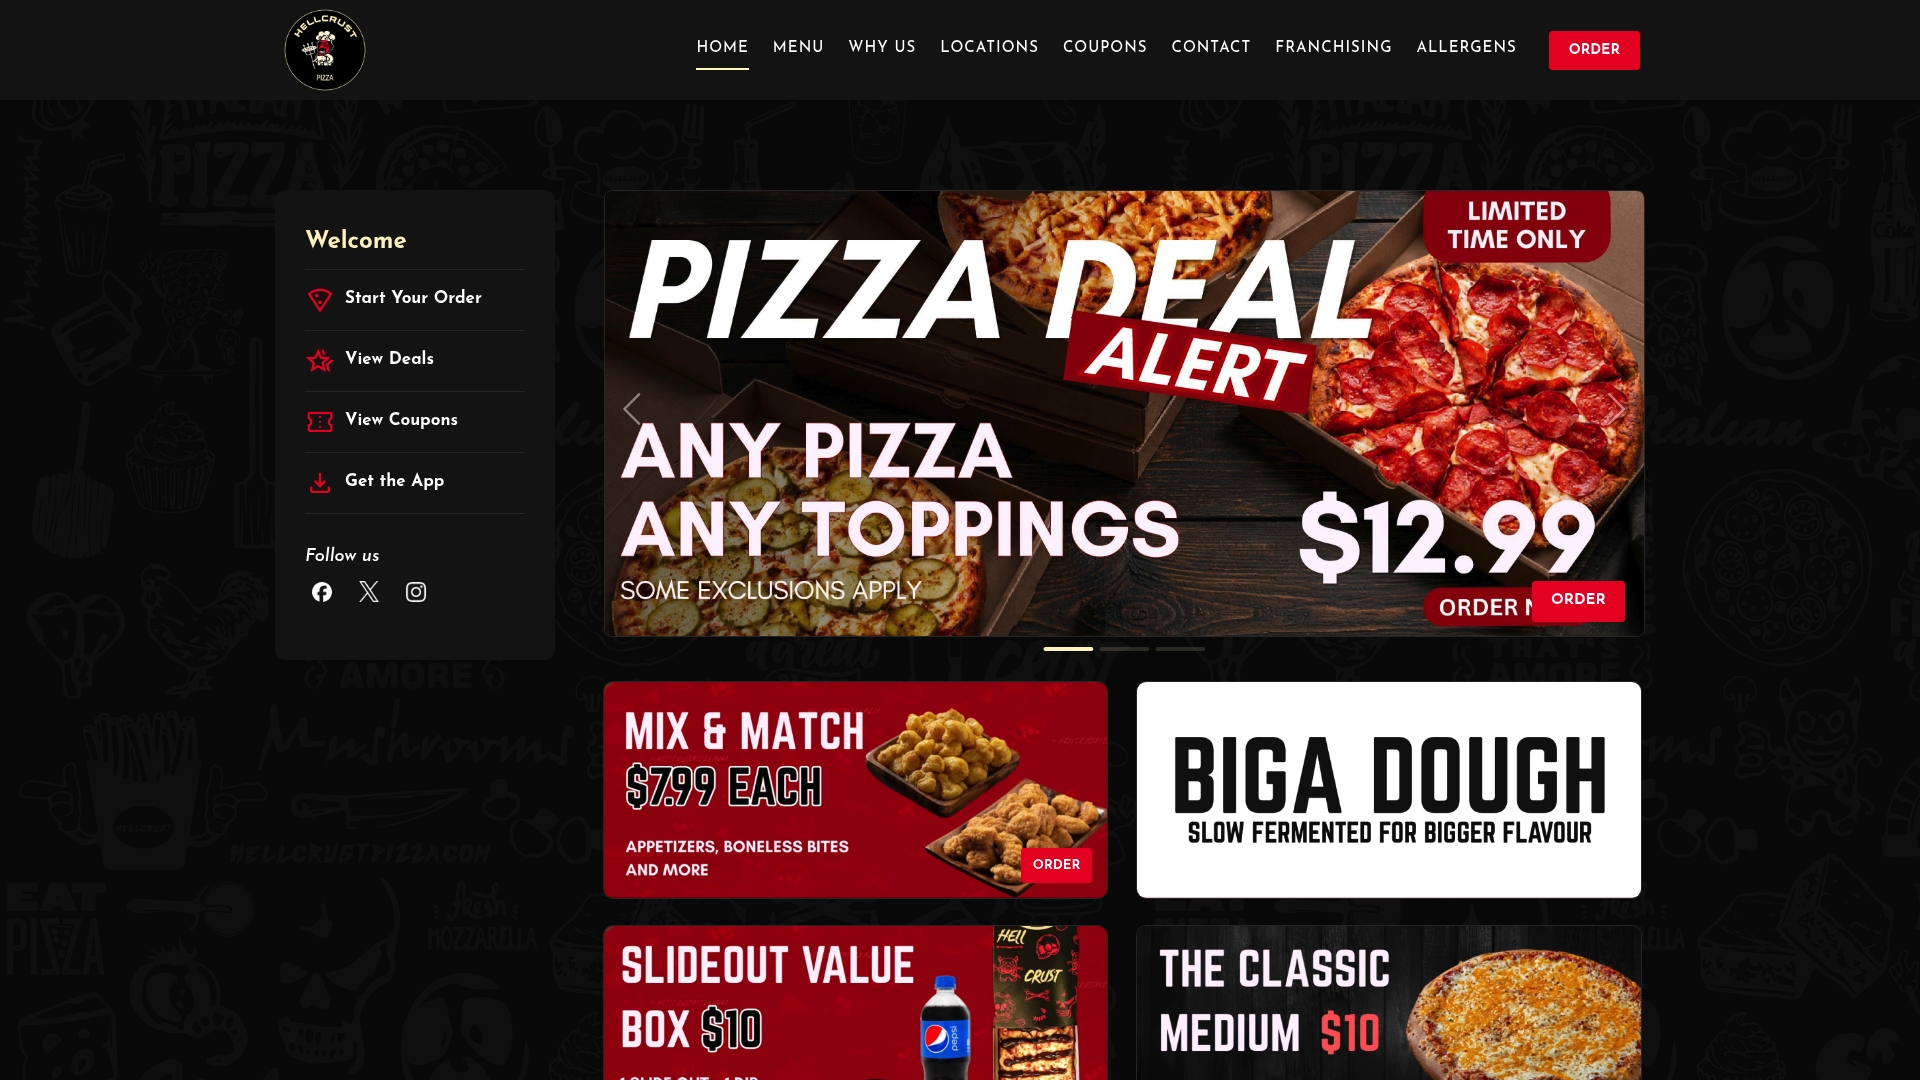
Support for new franchisees centres on operational guidance, app-based ordering infrastructure designed to drive repeat visits and direct orders, and deals crafted to lift average ticket from day one.
If you want a clearer sense of the product mix and pricing potential before you go further, browse our full menu to see the lineup you would be building a franchise location around.
FAQ
Is running a pizza shop profitable?
Profitability depends heavily on controlling food and labour costs relative to sales, since industry reporting shows nearly half of Canadian foodservice operators expect profitability to worsen amid rising operating costs. A well-run location with disciplined cost ratios and steady order volume can reach profitability, but it is not automatic.
How much does a pizza franchise owner make per month?
Monthly owner income varies widely by location, sales volume, and franchise fee structure, and no single figure applies across brands or territories. The honest approach is to build a break-even and profit model using your specific location's fixed costs, average ticket, and expected order volume rather than relying on an industry-wide average.
What are the top pizza franchises to consider?
There is no single authoritative ranking, and the right choice depends on your territory, budget, and the brand's fixed-cost and delivery commission structure rather than name recognition alone. Compare disclosure documents and talk to current franchisees across a few brands before narrowing your list.
How much profit does a typical pizza franchise make?
Profit margins vary by brand, location, and cost discipline, and quarterly industry outlooks show a meaningful share of foodservice operators sitting near break-even or at a loss rather than earning strong margins. Building your own break-even model with realistic local assumptions gives a far more useful answer than any industry-wide figure.
How do I calculate my own pizza franchise break-even point?
Divide your total monthly fixed costs by your contribution margin percentage to get your break-even sales in dollars, then divide that figure by your average ticket to get your break-even order count. Running this calculation with your own location's numbers, rather than a generic franchisor projection, gives the most reliable answer.